
Psychometrics is the science that studies the measurement techniques used in psychology, as well as the techniques for validating and developing these measurements. ComColors has opted for very rigorous psychometrics to guarantee the robustness of its model and the reliability of its results.
This article presents in detail the results of the psychometric research on the ComColors model.
Temporal stability of the ComColors scale
Stability is a criterion of fidelity which enables us to assess whether a scale remains reliable over time. The statistical indicator used to measure stability is correlation. To be considered stable, a person’s responses must be the same when they answer the same questions twice. If the answers are not stable, it means that the scale measurement is too ephemeral to be used. The accepted threshold for stability is .70. Overall, the scale items must meet or exceed this threshold.
The test/retest correlations for all the colours are as follows:
| Colour | Test/retest correlation |
|---|---|
| Red | 0.72 |
| Orange | 0.79 |
| Yellow | 0.70 |
| Green | 0.74 |
| Blue | 0.75 |
| Violet | 0.72 |
These correlations are all greater than .70, which is the recommended threshold for estimating whether a scale is stable, so we can conclude that all the colours in the ComColors model have a very acceptable stability coefficient.
Exploratory factor analysis
The psychometric validation of the ComColors questionnaire was developed under the direction of a doctor of psychology who applied current psychometric methodologies using the most recent research tools available to date (2012).
The first step was to create a questionnaire that could be used for exploratory factor analysis. This involved measuring the psychological dimensions of the six personality types in the ComColors model. To do this, we had to create an initial series of questions that we put to a group of around 130 people. In this way, we were able to distinguish reliable psychological dimensions from those that did not give rise to quality measures. We repeated this operation four times to obtain a clear measure of the psychological dimensions measured.
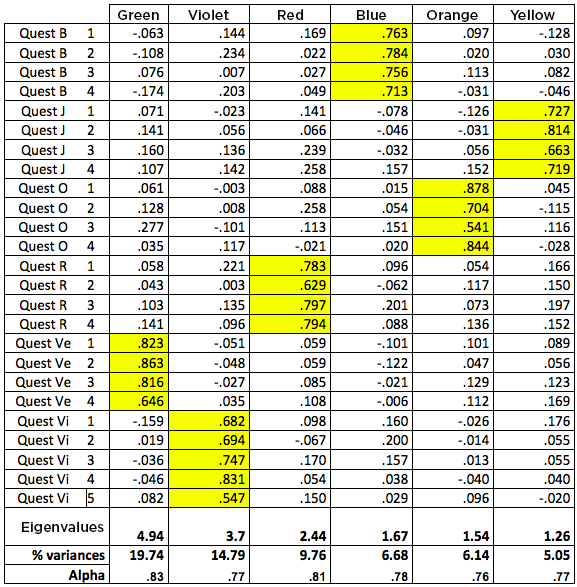
The table below is the result of the last exploratory factor analysis, which shows that, as expected, the items in one dimension (blue, for example) are highly saturated with only one factor and very weakly saturated with the factors in the other dimensions.
Following this final exploratory factor analysis (EFA), we undertook a more in-depth validation of the questionnaire structure by carrying out a confirmatory factor analysis (CFA) on 352 participants. Confirmatory factor analysis is a statistical technique that follows on from exploratory factor analysis. The aim of confirmatory factor analysis is to test the soundness of the theoretical model that emerged in the exploratory analysis. CFA is therefore a much more advanced stage in the research process than EFA.
Confirmatory factor analysis
The principle of confirmatory analysis is to check that the theoretical model does not differ from the observed model. In order to verify this absence of difference, indicators are calculated to measure the quality of the fit between the theoretical model and the observed model.
The first indicator to be taken into account is the χ2, which is used to calculate the existence of a difference between the observed covariance matrix and the estimated covariance matrix. If the ideal is to accept the null hypothesis, this test poses a problem because it depends on the size of the sample and the number of parameters in the model being tested. To avoid these distortions, the interpretation of different indicators aims to obtain a better estimate of the quality of the fit.
In this research we retained a certain number of adjustment indicators which are commonly accepted to verify the quality of the observed model.
The CFI (Comparative Fit Index) and the TLI (Tucker-Lewis Index) are indicators that are based on the deviation from the independence model. These indicators examine the difference between the chi2 of the tested model and the chi2 of the theoretical model. Their value can vary theoretically from 0 to 1. They are considered to indicate a good fit from values of around .90.
The RMSEA (Root Mean Square Error of Approximation) makes it possible to evaluate the normalized differences between the observed matrix and the estimated matrix. The authors consider that a value equal to or less than .06 is a guarantee of a good fit.
A final category of indicator focuses on the explained variance. The standardized SRMR (Standardized Root Mean Residual) is the square root of the mean of the sum of the squares of the residuals of each cell of the matrix. The authors consider that a value equal to or less than .05 is the sign of a good fit.
The GFI (“Goodness of Fit Index”) takes into account the variance of the observed matrix on which the model is based. This indicator theoretically varies between 0 and 1, with an adjustment value at least equal to .90.
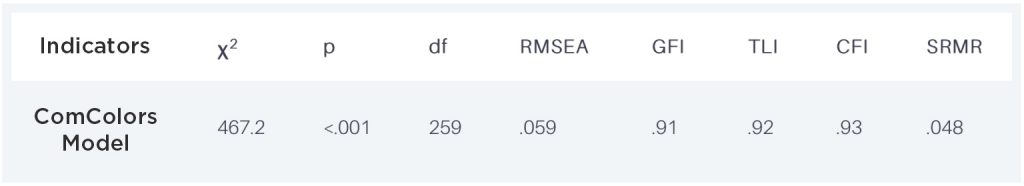
As we can see from the table above all the fit indicators reach and generally exceed the recommended thresholds, it is therefore justified to say that the ComColors model fits the data correctly and it can therefore be considered valid from a structural point of view.
The research work that supports the ComColors model has been designed and maintained to guarantee the robustness of its model and the reliability of its results.
Dernière mise à jour le 19 February 2024